<Preamble>
Several years ago I began a project to monitor all the energy consumption in my house. After all, the first step in making something more efficient is understanding where you’re starting from. Last month I received a $300 water bill. I knew the water usage in August would be high as I was watering our lawns and the field beside us nearly every day to combat the dry weather we’d been having, and the utility company charges for waste water disposal (sewer service) based on a percentage of your water usage. Granted, this formula quickly falls to the city’s favor when you start watering your lawn, but then again – doesn’t everything default in someone else’s favor?
Venturii VDAC firmware includes an OnBoard device type called an IRBS, or Infrared Beam Sensor. Although I use this now to measure my gas consumption, it was originally developed to monitor my water consumption. Actually, it can do both very accurately, but it has a limitation. Here’s how it works: The Infrared Beam Sensor fires a beam of light at the face of your water / gas / electrical meter (if it is of the old mechanical style) and measures the amount of infrared light that returns to the sensor. It then turns off the infrared light source and takes another measurement to determine the ambient reading, and produces a result from the difference. By analyzing the readings from an IRBS, the Trend Processor can determine when the value is rising and falling, the result of which can then be used to provide input into a counter, and the counter can keep track of how many times the needle under the sensor makes a full circle. By aiming the IRBS sensor at the least significant indicator, you can usually get the most detailed consumption data. For example, my gas meter has one wheel whose full circle rotation indicates the consumption of exactly one half a cubic foot of Natural Gas. This is the wheel I monitor, naturally, and doing so gives Venturii a look at my house’s gas consumption, accurate to 0.5 cubic feet.
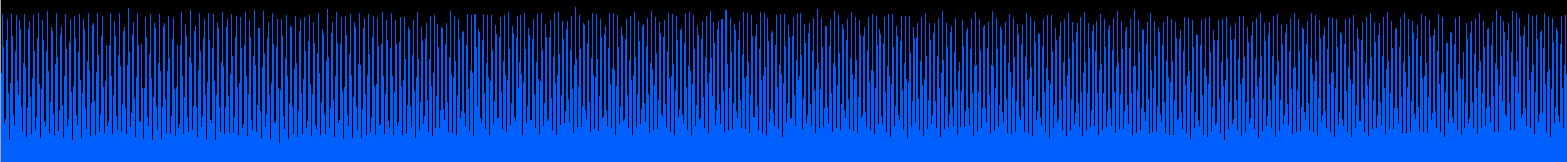
That’s pretty good resolution, and it makes monitoring gas usage very easy. By measuring the time between pulses, I can also determine the approximate flow rate of gas. Here is a graph produced by the Infrared Beam Sensor mounted on my gas meter. The red line indicates the level of ambient light measured by the sensor, the green line indicates the combined value of the illuminated + ambient light, and the blue line indicates the normalized value, or the difference between the two. Because the blue line is measuring the reflectance, every time it dips indicates the passage of the black needle between the sensor and the white reflective background:
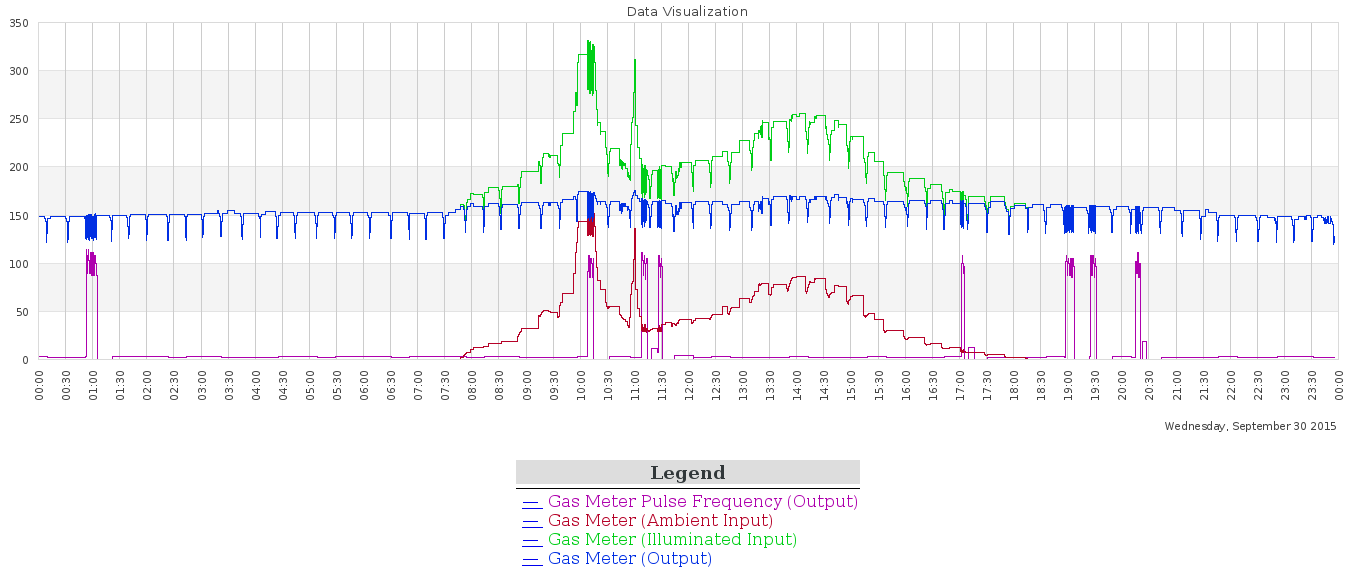
Venturii Infrared Beam Sensor (IRBS) Graph with Pulse Frequency Analyzer
“What about the purple line” the observant reader may be asking. The purple line comes from another OnBoard Device (OBD) Type within the Venturii Data Acquisition & Control (VDAC) unit called the Event Rate Monitor (ERM.) Event rate monitors mark the amount of time that passes between rising, falling or both edges of a digital input.
If we zoom in on that first burst of activity around 01:00 AM, we see the following graph:
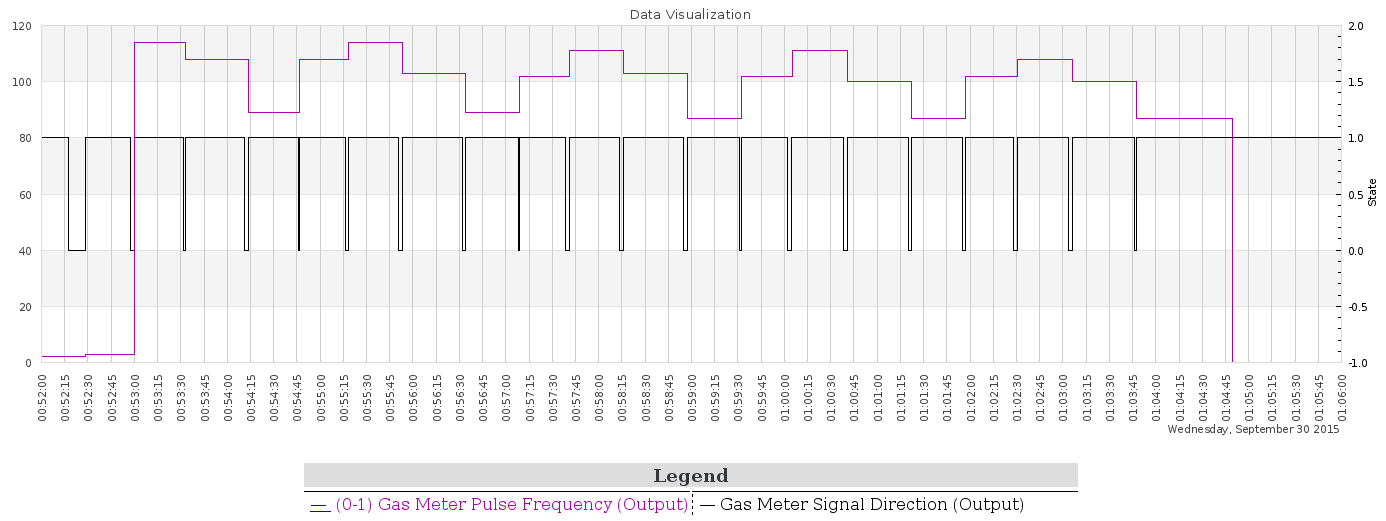
A graph showing the gas consumption rate for a heating session of my hot water tank with half cubic foot trend output overlaid.
This graph illustrates two ways of looking at a single number originating from the Trend Analyzer fed by the IRBS (Infrared Beam Sensor) monitoring the half cubic foot counter wheel on my gas meter. The black line indicates the binary state of the trend, illustrating the direction of the analog waveform it is monitoring. Every time the half cubic foot needle passes under the sensor, less light is reflected back (the needle is black; the background is white) and so it produces a 1 or a 0 depending on whether the value is rising or falling. This gives us a rising and a falling edge. The purple graph measures the time delta between the rising edges of each transition. (On a side note you can see an interesting four-stage trend in my gas meter, probably due to the mechanical workings therein.) During this call for heat in my hot water tank, I burned 10 cubic feet of gas (each pulse represents half a cubic foot. 20 * 0.5 = 10) The burn time was approximately 11.5 minutes (Assuming 00:52:30 – 01:04:00) – so 10,000 BTU / 11.5 * 60 = 52,174. Considering my hot water tank is rated at 50,000 BTU / Hour, and considering that I did not factor in the [exact] run times of the burner, the 2.1k BTU difference is easily explained and this graph gives a reasonable estimation of usage rate. Some day I’ll convert the raw time between pulses into BTU/h.
At one time I had a similar sensor set up on my water meter. However, the needle that rotates around the face of my water meter indicates a much more course unit of measurement, where one rotation of the red needle indicates 10 liters of water consumed. Thus, using this needle alone would give me a view of my water usage accurate only to the nearest 10 liters. That’s not terrible, I found it very hard to measure flow rate, especially at low flow rates (IE: Leaks) or in short bursts that do not cross two 10 L boundaries (Washing hands, flushing toilet, etc.) My water meter has a much smaller black “spinner” that rotates *much* faster than the larger red needle, but I found that getting an IRBS to accurately detect it’s tiny cog-like edges was intermittent at best, and was also thwarted every time the red needle also passed between the black spinner and the IRBS. Eventually the elastic bands that held the sensor in place broke and the silicone that held the sensor in place peeled off, and so I stopped monitoring water consumption. The structure beneath the water sensor where my prototyping [boards] were sitting also went away, leaving me no “nice” way to support the monitoring electronics.) I decided that I’d wait until I had a better solution for monitoring the water usage and probably a custom PCB before re-mounting the sensor.) Last night I proved a theory which paves the way to providing that better way to monitor the water usage!
</Preamble>
Up until now these methods of monitoring consumption have been quantity-based. We have measured cubic feet of gas and liters of water. What I’d like to measure in addition to these metrics is the rate of flow of that water. I’d like to know the rate of flow for each sprinkler zone in my house. I’d like to know the rate of flow for each shower head, faucet, washing machine, dishwasher, and humidifier, so that I can learn to detect patterns and trends in the usage data and even identify problems in my water system. For example, if I know that zone 6 normally flows at 15 Liters per Minute, but suddenly detect it flowing at 30 Liters per Minute, there’s a pretty good chance I’ve got a broken pipe or damaged sprinkler head. Plus, part of me just likes to know these things for the curiosity of it.
The question is how??
The answer is with a hall effect sensor.
Hall effect sensors measure magnetic fields. Depending on the type of sensor and the supporting circuitry used, some hall effect sensors can even detect the earth’s natural magnetic fields. In our case of measuring the flow of water, I wanted to know if a hall effect sensor could detect and measure the movement of the magnets within the mechanical portion of my utility-installed water meter. Since it is used for billing purposes, the utility company has incorporated security features into the installation of the meter to prevent others from opening it up and tampering with it’s operation. Even so, I am optimistic that I can still detect the passage of water through the meter entirely passively – that is, without making any modifications to the water meter itself.
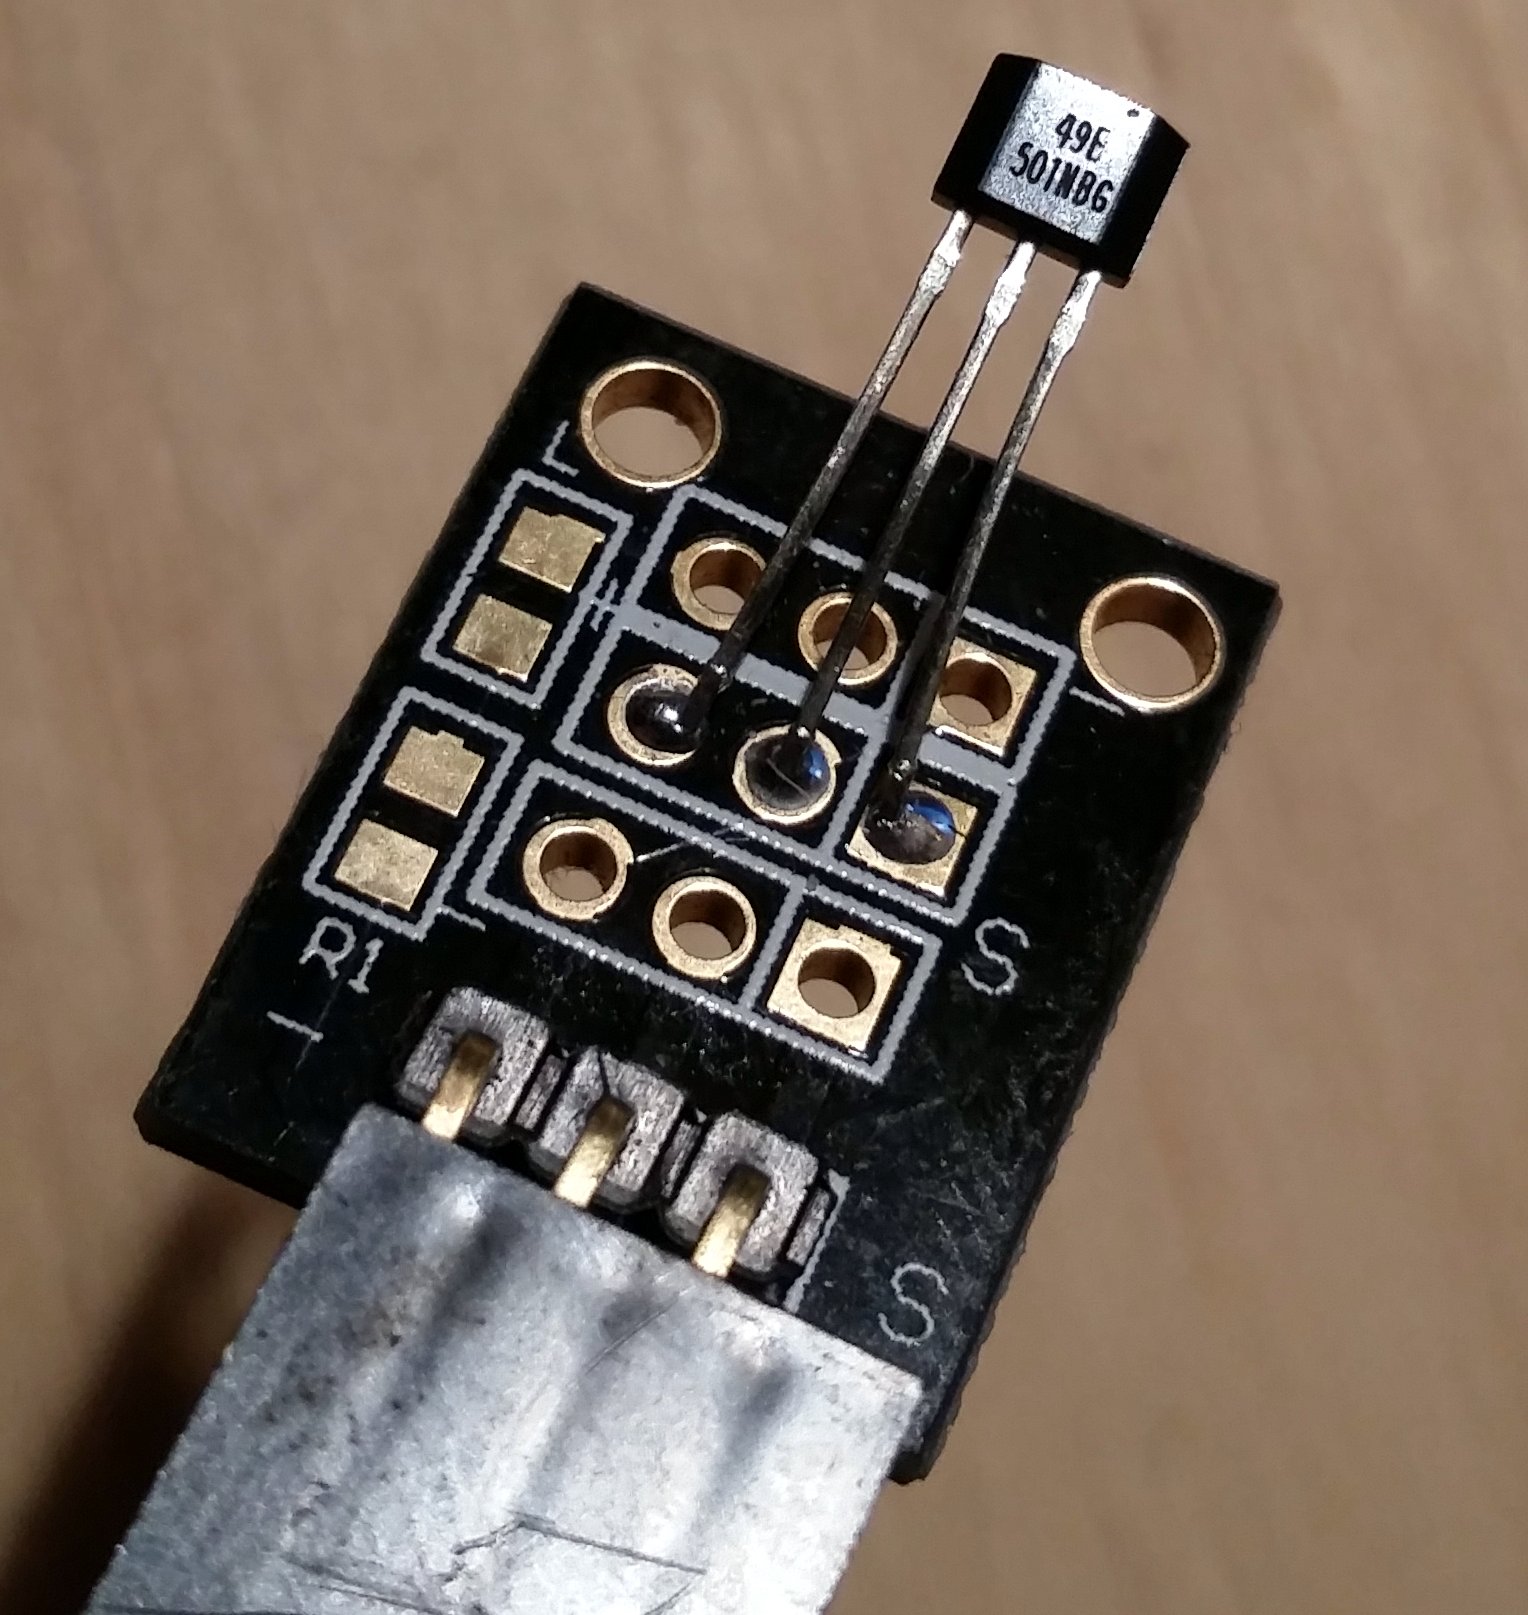
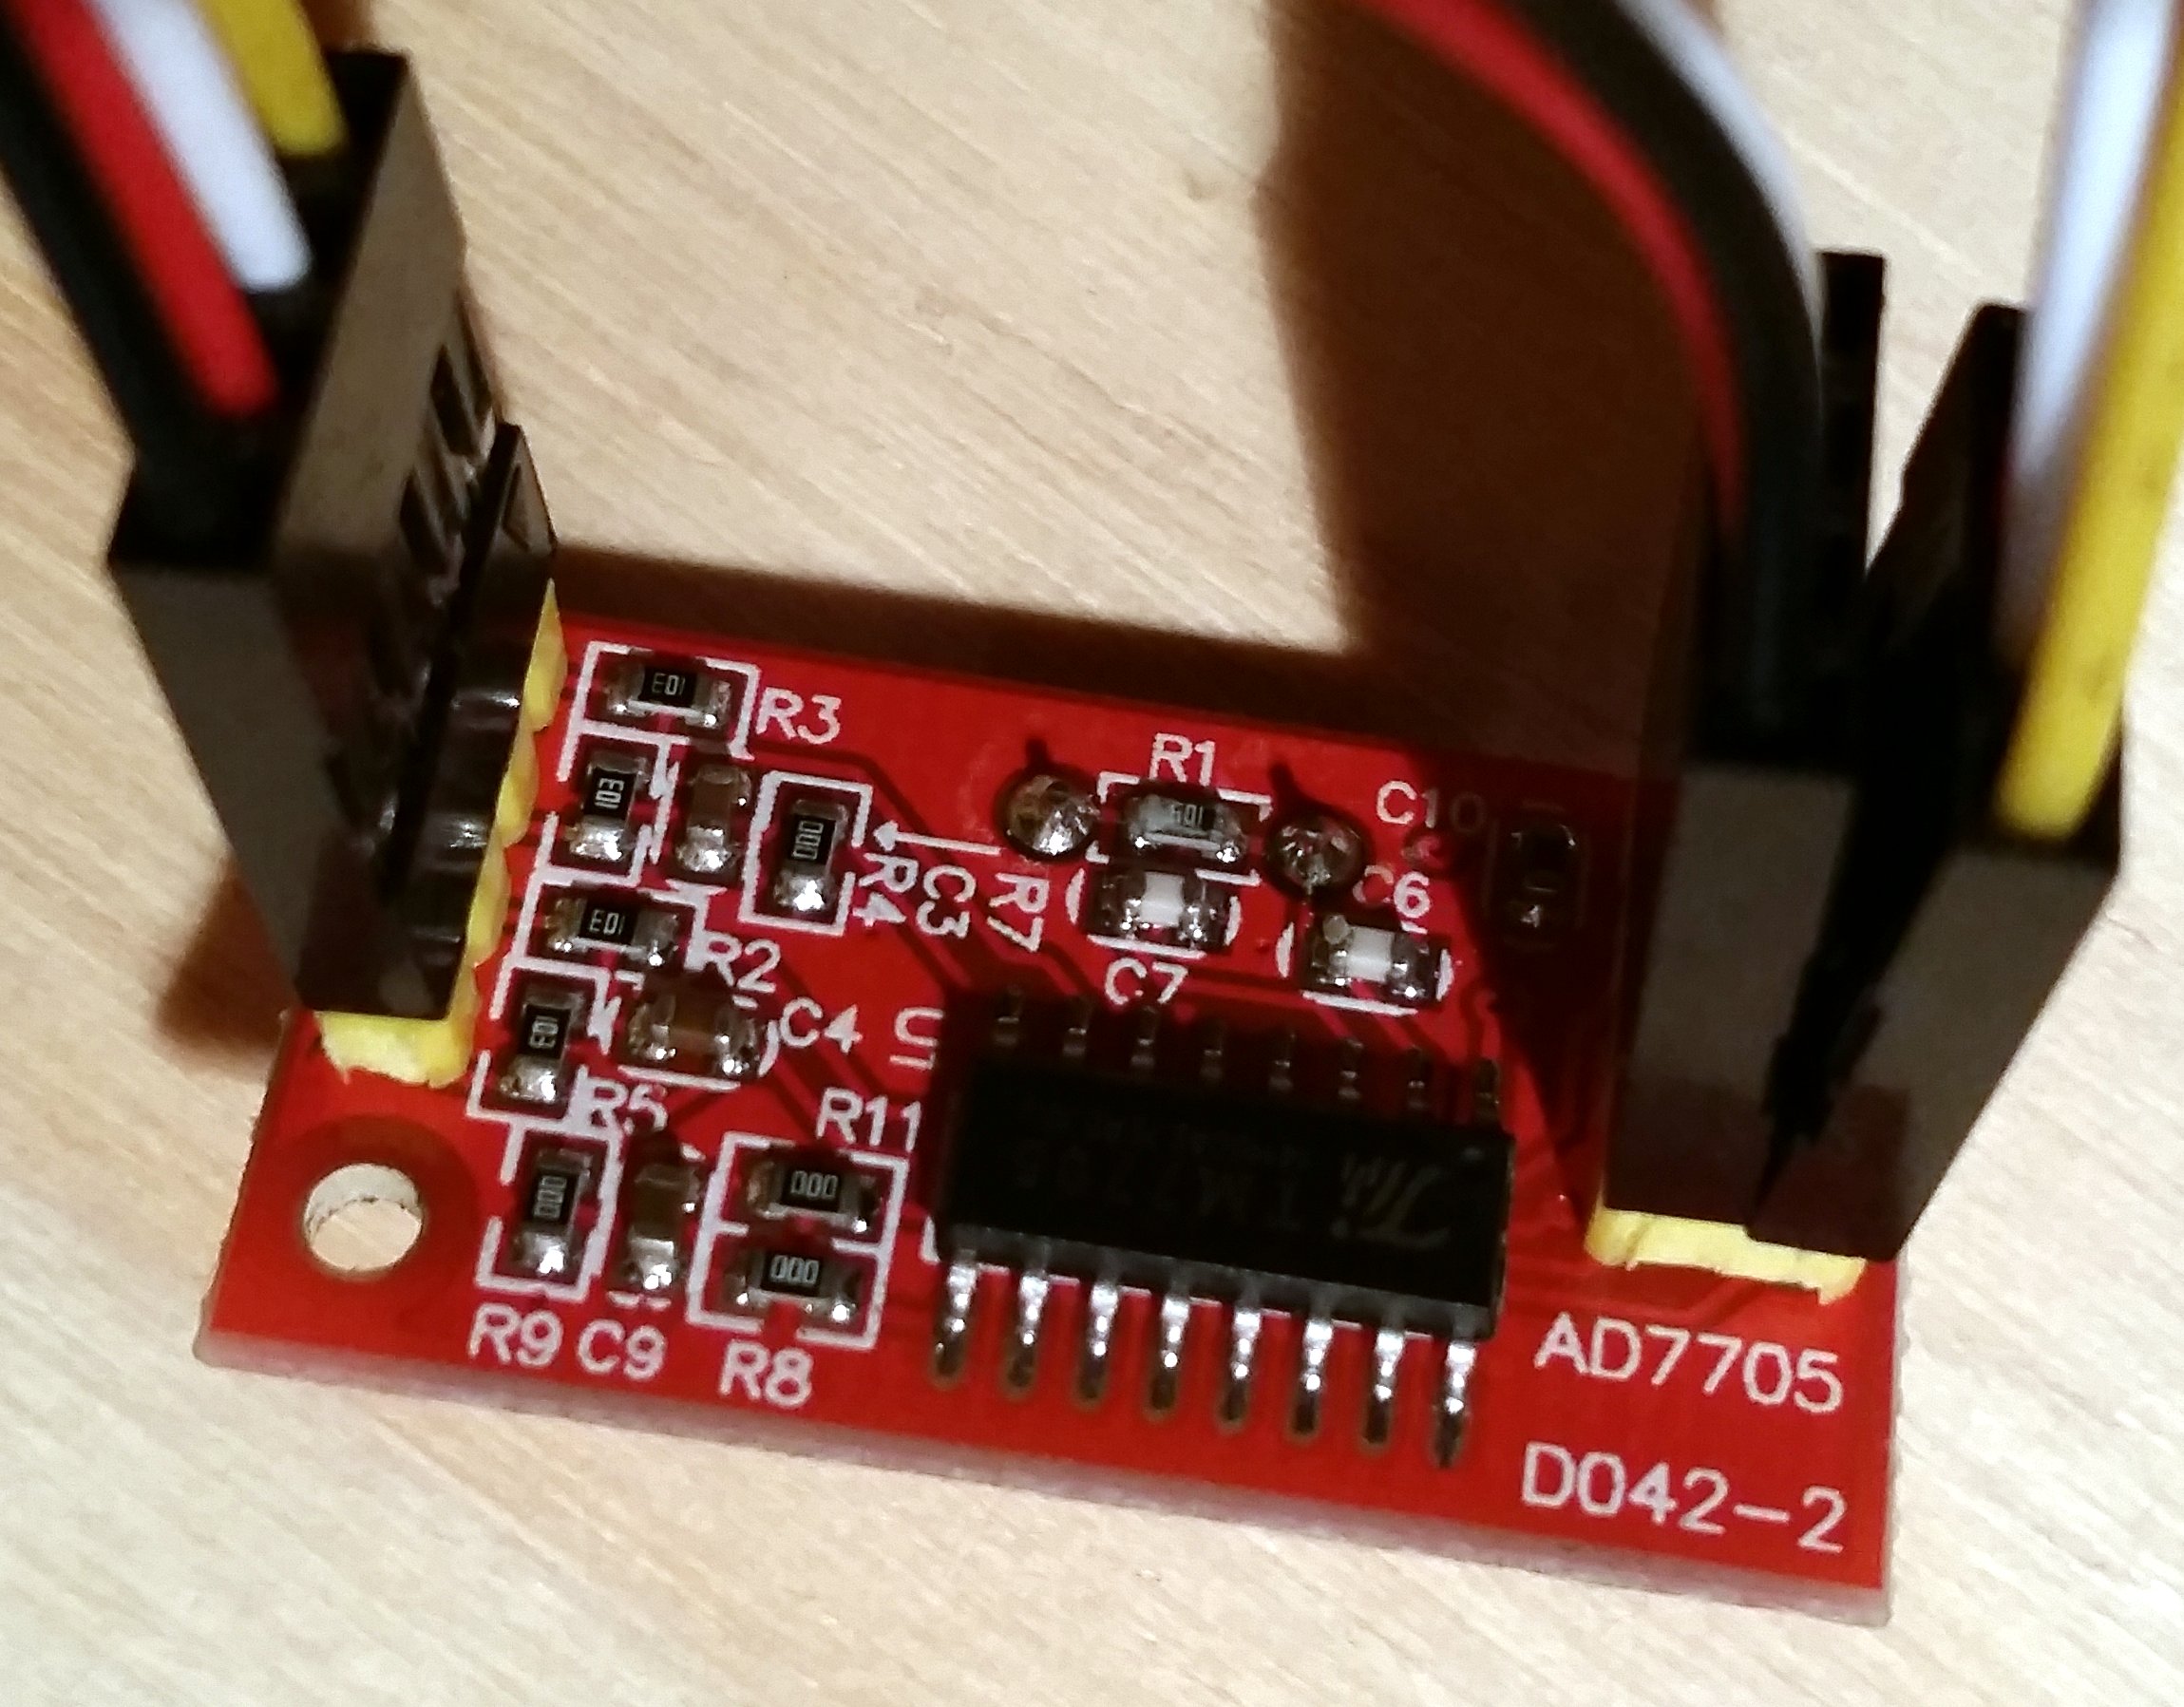
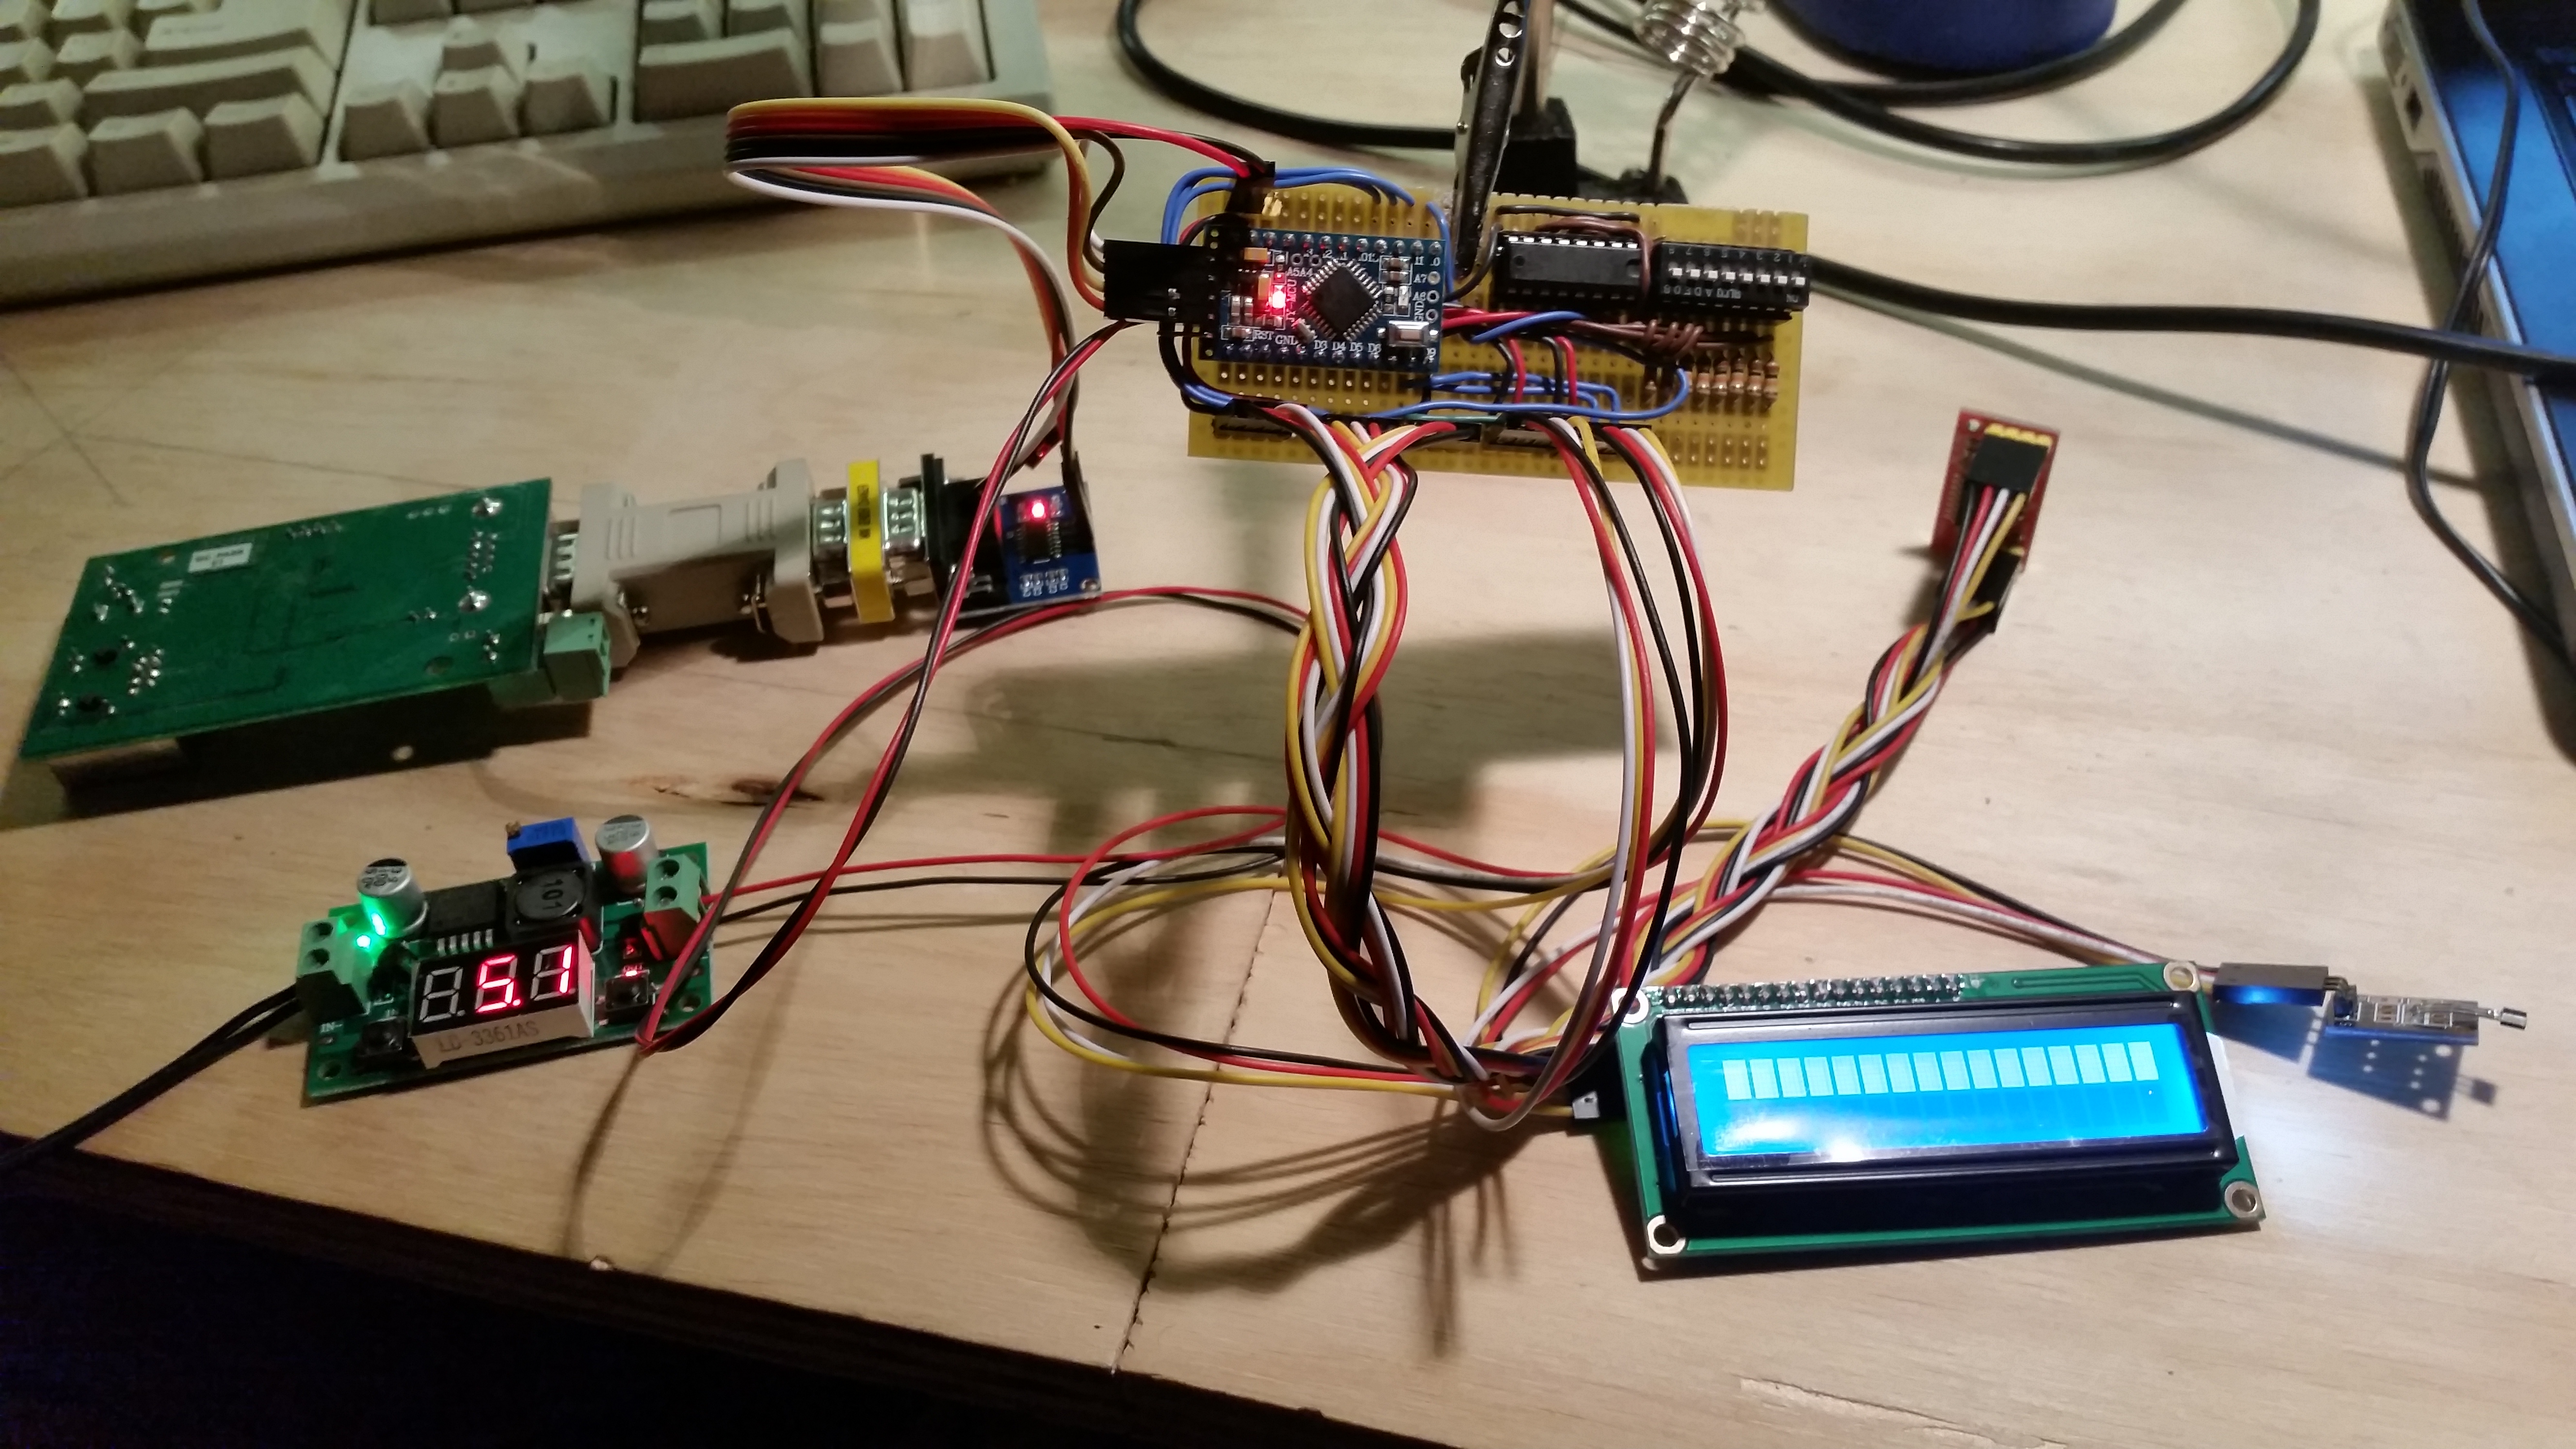
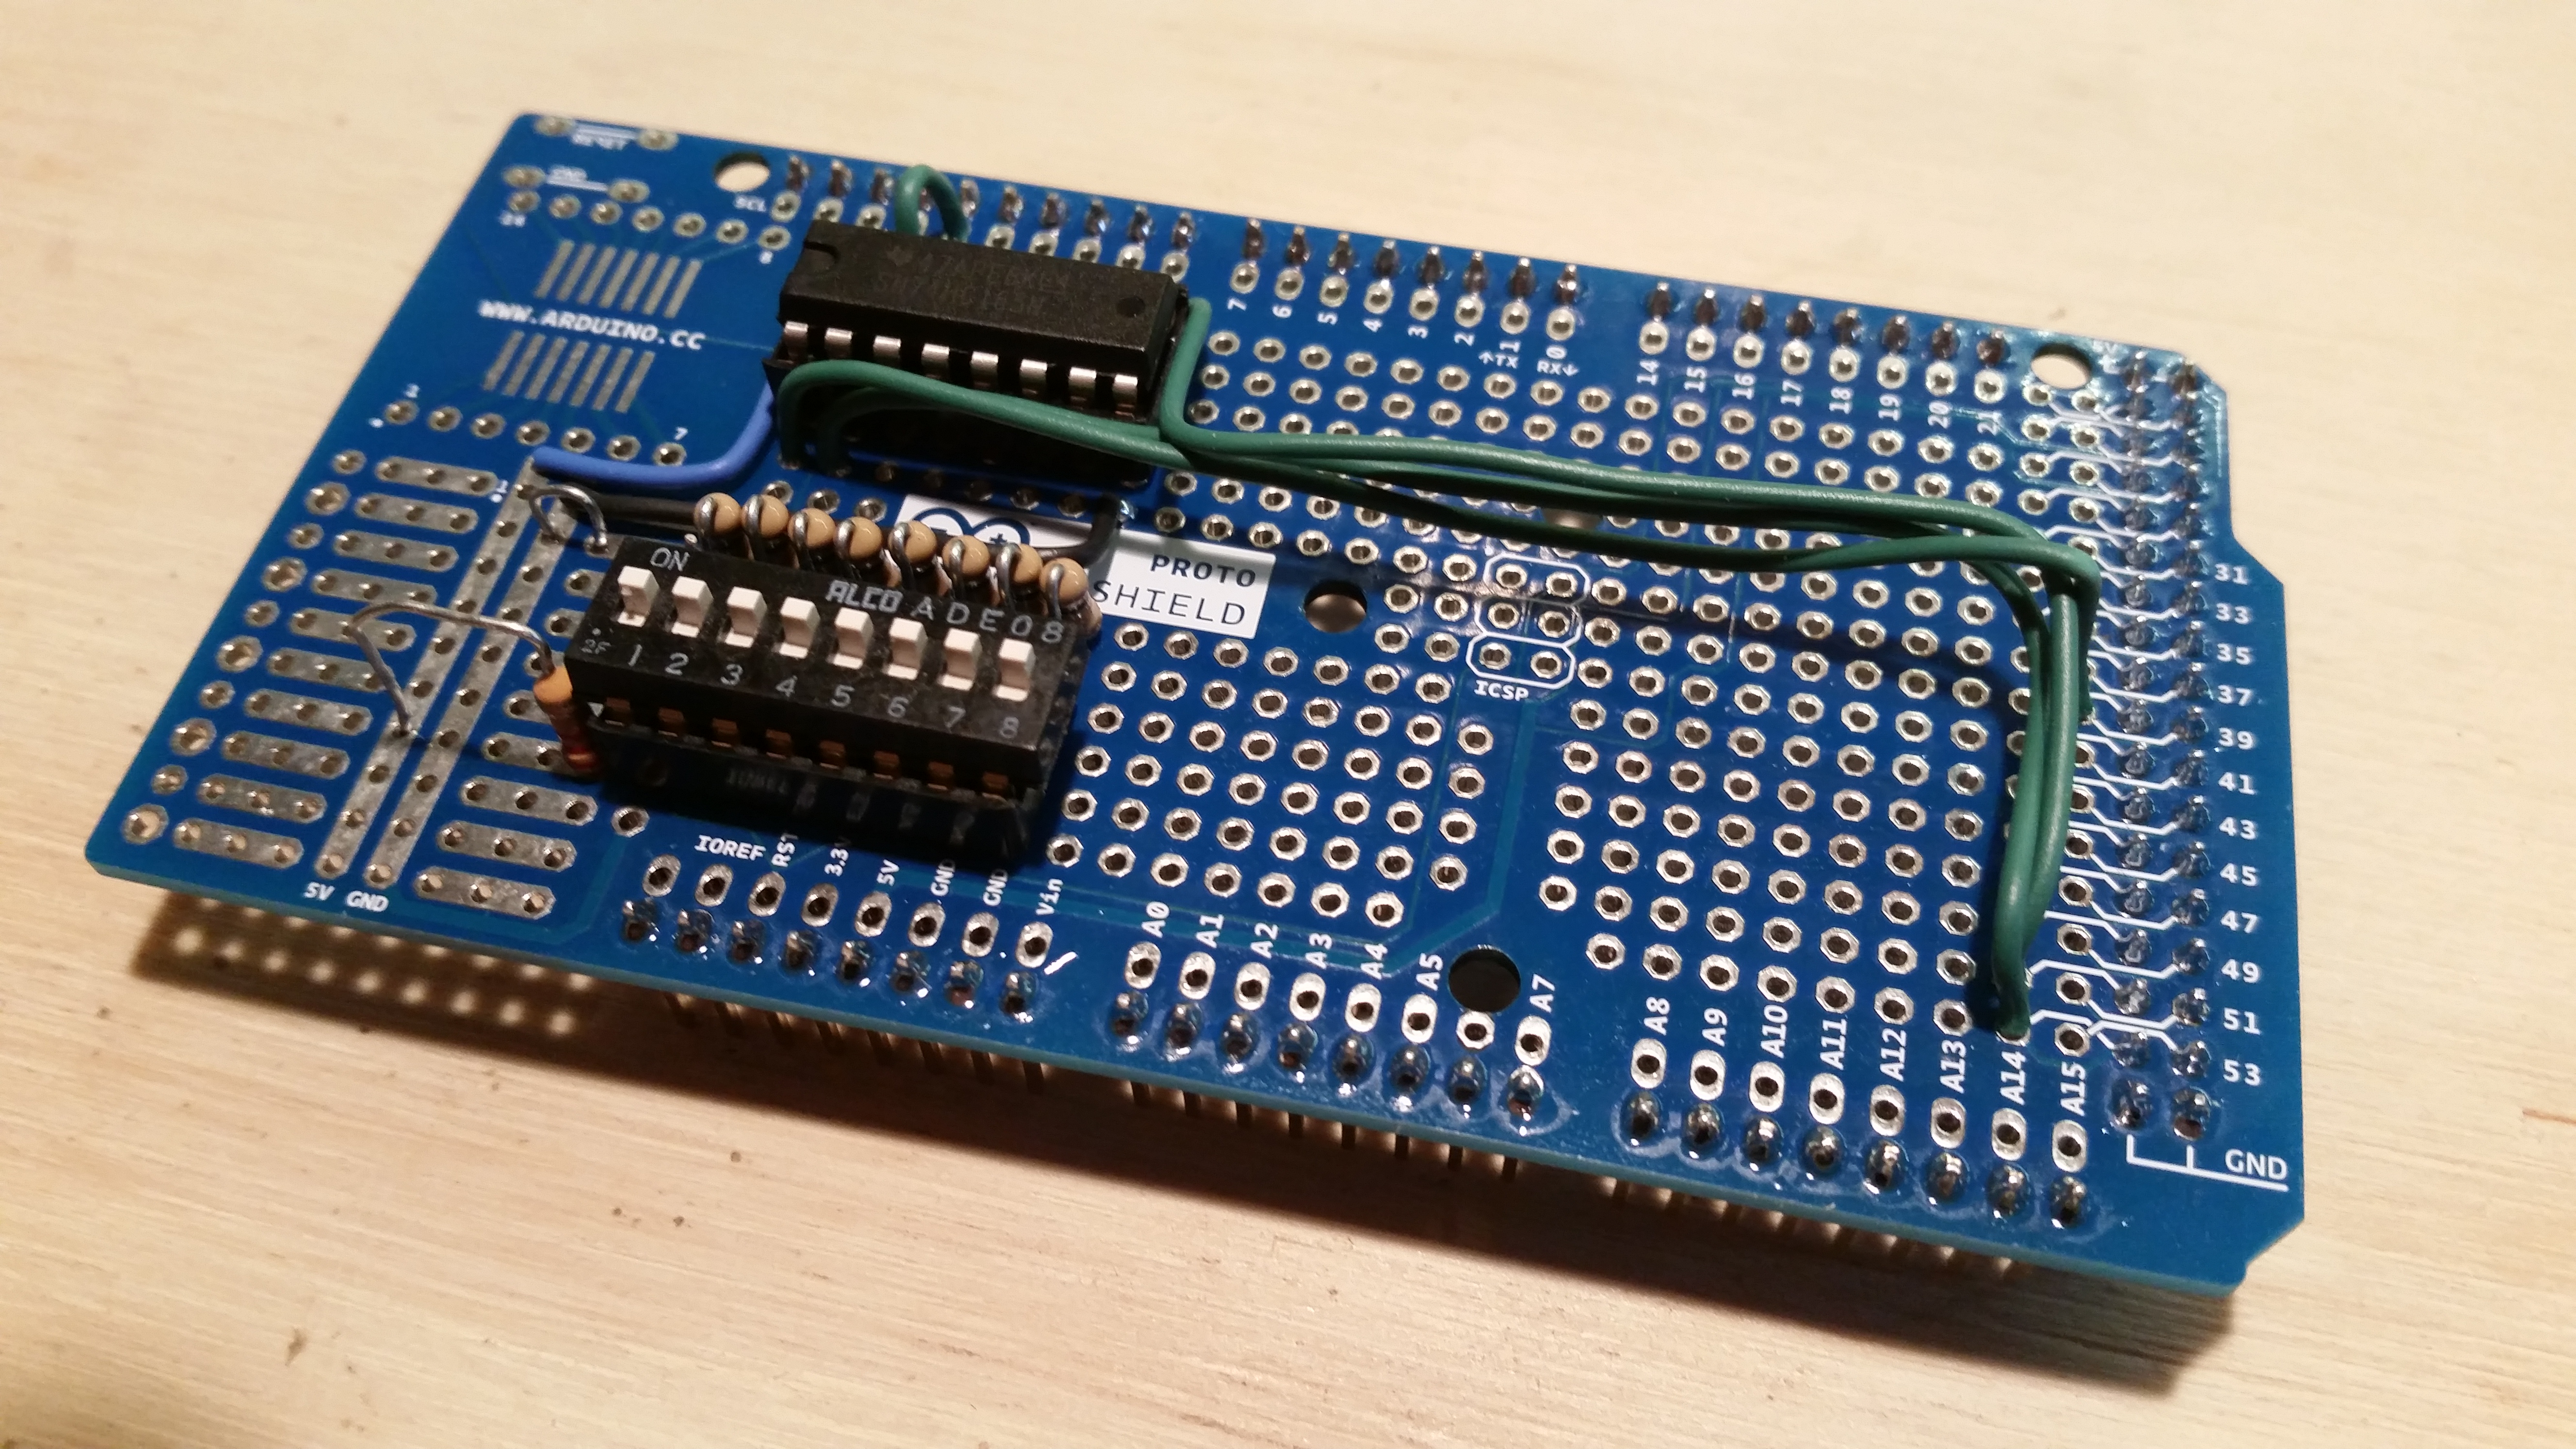
Some time ago Mark brought in a variety pack of sensors from AliExpress. For the home hobbyist / tinkerer, this kit was a great value and included all manner of devices for measuring movement, vibration, tilt, temperature, humidity, flame, sound, light (visible and invisible) and probably a few other phenomenon I have yet to discover. This kit also included two types of hall effect sensors. One is a switch type, whereby it produces a binary signal once a magnetic field of sufficient strength is detected, while the other one is based on an Sec Electronics SS49E Hall Effect Sensor (Pictured). After some preliminary testing, I connected it to an Arduino Uno using an AD7705 16-bit Bi-Polar Analog to Digital converter for extra precision and signal amplification since the type of field I’m probably going to encounter in the water meter is very small. As it turned out, the field was actually strong enough that I could measure it with a compass app on my phone! After some tuning to find the best position, orientation and perceived field strength, I taped the 49E hall effect sensor in place and began capturing data from it with a small amount of water (my flow-through whole-house humidifier) running:
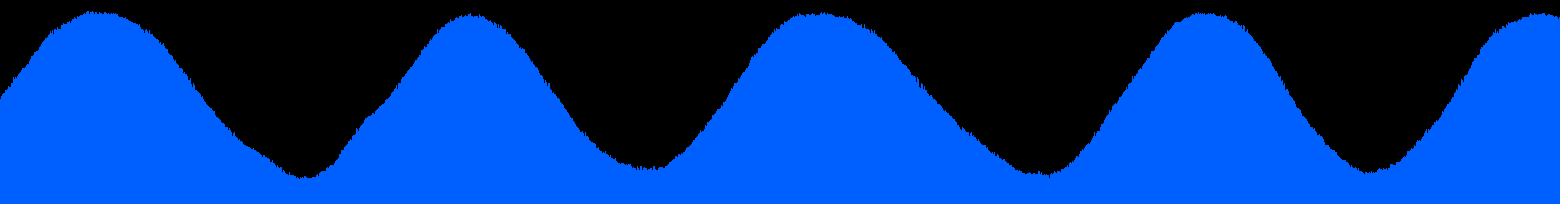
A graph showing my water meter’s magnetic fields during the operation of a Flow-Through Humidifier.
The result is a near-perfect sine wave! There is certainly sufficient range there to detect even the slightest changes (leak) in water flow, but how would it perform at higher flow rates? Keep in mind that this graph represented about 60 seconds of data, and a pretty slow trickle of water. I decided to try turning on a sprinkler zone outside:
Preliminary Water Meter Magnetic Field Measurements with Underground Sprinkler Zone Activated
I believe the effect you can see in this previous graph is call harmonics. What a beautiful picture! Still determined to see the upper limit, I opened up all my sprinkler zones simultaneously, to try and get as much water moving through the meter as possible:
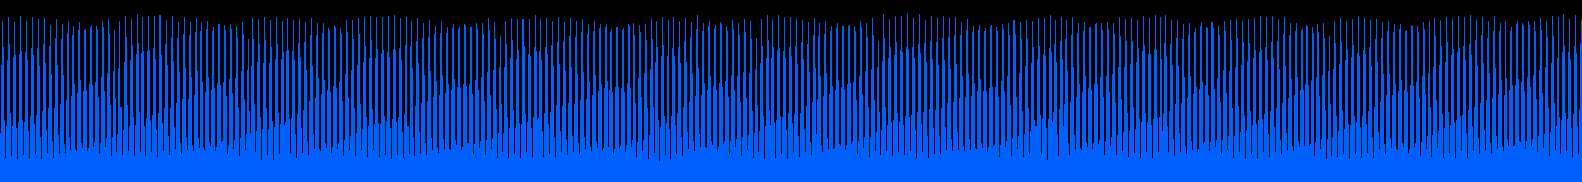
Preliminary data from a hall effect sensor monitoring the magnetic flux outside the body of a Badger water meter. For this image, I turned on all my outside sprinklers. Several harmonic patterns are visible in the graph.
The results were more tumultuous, but clear distinctions could still be seen, and this with a sample rate of only 500 Hz. Clearly I believe this combination of hardware and software will be able to measure both minute and massive flow rates of water. One more chart, this one a bit of an interesting one.
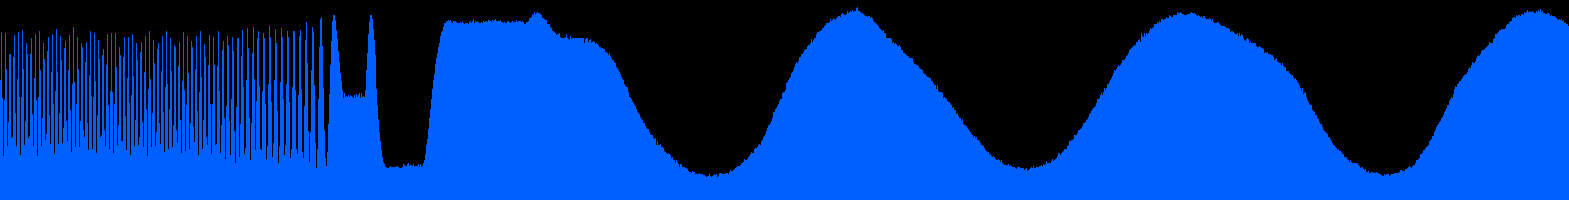
Preliminary data showing the resulting magnetic flux measured when high volume of water flowing through the water meter is quickly reduced to a slow trickle.
This chart illustrates the resulting magnetic flux measured when a large volume of water flowing through the water meter is quickly reduced to a slow trickle. The observant viewer may even notice the effect of a water hammer, or back-pressure; Those more artistic and less interpretive may see this as Batman’s head and ears between the narrowly spaced oscillations and the widely spaced ones.What you’re seeing is the water meter mechanism actually reverse direction momentarily in response to the sudden closure of the sprinkler zone valve. The plastic PEX pipes in the house swell slightly at the sudden increase in pressure and some water is pushed back through the meter. You can see this in the graph where it transitions between the two frequencies.
All that to say, I think there is great potential to use this sensor for measuring water flow and to concurrently use the IRBS to measure water consumption. Viva Venturii!